Inside the Count: How Iowa Baseball pitchers fare in each count

The Iowa Baseball team has far outpaced any preseason expectations, sitting atop the Big Ten standings with just four weeks left to play in the regular season. Although there’s still work to be done, the Hawkeyes control their own destiny when it comes to securing their first Big Ten regular season title since 1990.
As good as the offense has been, the pitching staff has made impressive strides under first-year pitching coach Sean Kenny. The Hawkeyes lead the Big Ten in ERA (3.65), strikeouts per nine innings (10.6), opponent batting average (.216) and WHIP (1.26), while they also rank third in walks per nine innings (4.3).
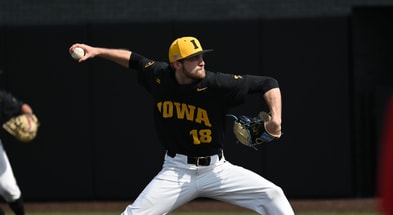
Junior left-hander Cade Obermueller is having a Big Ten Pitcher of the Year caliber season, with his 2.50 ERA ranking second in the conference behind Michigan State’s Joseph Dzierwa. Meanwhile, Aaron Savary (3.67 ERA) and Reece Beuter (3.99 ERA) both rank top 15 in the Big Ten in ERA.
Top 10
- 1Breaking
Shedeur Sanders
Not selected in NFL Draft 1st round
- 2New
Picks by conference
SEC, Big Ten dominate NFL Draft
- 3
Joel Klatt calls out
'Trash' Shedeur Sanders narrative
- 4
10 Best Available Players
After NFL Draft 1st Round
- 5Hot
ESPN roasted
For Shedeur Sanders empty couch
Get the On3 Top 10 to your inbox every morning
By clicking "Subscribe to Newsletter", I agree to On3's Privacy Notice, Terms, and use of my personal information described therein.
What type of counts are the Iowa pitching staff getting into?
The first thing that stands out when looking at this chart is that Hawkeye pitching staff has done a good job throwing first pitch strike, getting ahead in the count in 60.1% of at-bats. Rick Heller’s starting rotation has been particularly solid, throwing first pitch strike in 61.9% of at-bats.
One other thing that stands out, which you could argue is even more important than throwing a first-pitch strike, is the pitching staff’s ability to recover after falling behind in the count. They have done an exceptional job of getting back into the zone after throwing first-pitch ball, with just 17.8% of those 551 1-0 counts turning into a 2-0 or 3-0 count. Avoiding those counts is a big reason why Iowa’s walks per nine innings has dropped this season.
| COUNT | TIMES | FREQUENCY |
| FIRST PITCH STRIKE | 848 | 60.1% |
| FIRST PITCH BALL | 562 | 39.9% |
| 0-0 | 156 | 11.1% |
| 1-0 | 353 | 25.0% |
| 2-0 | 130 | 9.2% |
| 3-0 | 68 | 4.8% |
| 0-1 | 410 | 29.1% |
| 0-2 | 292 | 20.1% |
How are Hawkeye pitchers finishing at-bats based on the count?
***Errors are counted as outs for the pitchers and not free bases given up***
| COUNT | TIMES | OUT/ERROR | HIT | FREE | OPP AVG | OPP OBP |
| FP STRIKE | 848 | 598 | 167 | 82 | .218 | .294 |
| FB BALL | 562 | 322 | 87 | 153 | .213 | .427 |
| 0-0 | 156 | 107 | 38 | 11 | .262 | .314 |
| 1-0 | 353 | 234 | 67 | 55 | .223 | .337 |
| 2-0 | 130 | 75 | 17 | 41 | .185 | .423 |
| 3-0 | 68 | 19 | 3 | 46 | .136 | .721 |
| 0-1 | 410 | 271 | 90 | 58 | .249 | .339 |
| 0-2 | 292 | 237 | 39 | 18 | .141 | .188 |
Where Iowa’s remaining opponents rank nationally in key offensive categories
Western Illinois: .287 AVG (104th), .377 OBP (182nd)
Saint Thomas: .303 AVG (51st), .394 OBP (105th)
Indiana: .306 AVG (42nd), .422 OBP (27th)
Illinois State: .304 AVG (45th), .404 OBP (80th)
Washington: .264 AVG (214th), .374 OBP (199th)
Illinois-Chicago: .260 AVG (232nd), .373 OBP (207th)
Oregon State: .304 AVG (47th), .415 OBP (41st)
Oregon: .301 AVG (55th), .420 OBP (30th)