Kentucky's shot charts have been a thing of beauty

If you’ve watched even just a few minutes of Kentucky basketball this season, you don’t need analytics to know this team is fun. You don’t need fancy shot charts to know this team is full of good shooters who can light up the gym. And you don’t need advanced statistical comparisons to last year’s squad to appreciate the tremendous uptick in production these incoming players have provided.
But sometimes, all these things are nice to have anyway.
While we know Kentucky is first in the nation in assist-to-turnover ratio, third in points per game, and fourth in effective field goal percentage, let’s look at what makes all those numbers work in unison: shot selection.
Get out of here with those midrange 2s
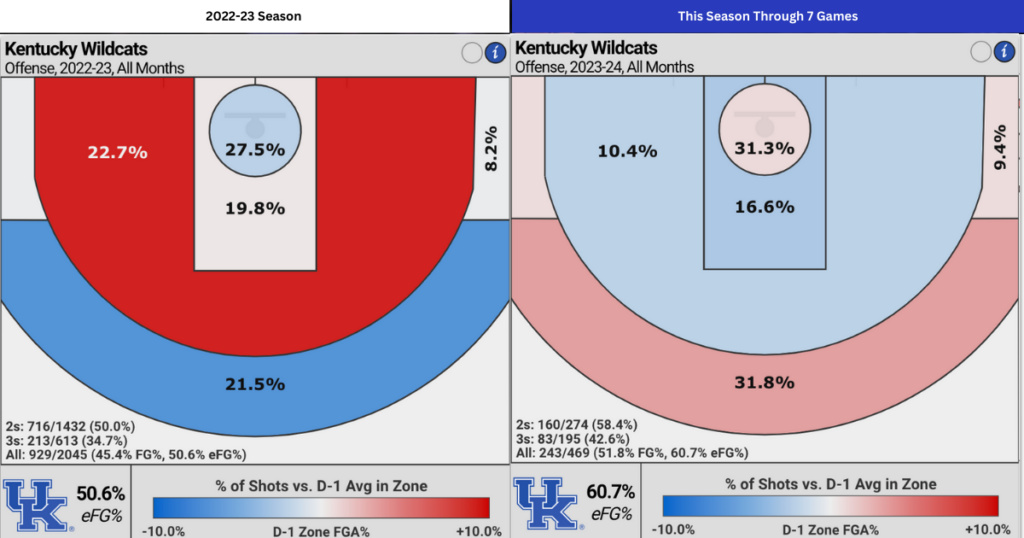
Last season, Kentucky ranked in the 99th percentile of all college basketball teams in percentage of their field goal attempts that were midrange 2s. According to CBBAnalytics.com, 22.7 percent of all their shots came from this dubious area on the court.
That’s not great, but what a difference a year, John Welch and a handful of quality shooters make.
With a fresh five-out offensive scheme with a focus on getting points both close to the rim and behind the arc, this year’s version of the Wildcats makes the 2022-23 rendition look like something out of the 1922-23 season.
Through seven games thus far, Kentucky has cut down its frequency of midrange 2s by more than half compared to last season, down to just 10.4 percent of their total shots. That puts Kentucky in just the 36th percentile in all of college hoops.
Much better.
To put it more simply, one out of every 4.5 shots last year was a midrange 2. This year, the no-man-land jumpers make up only one in every 10 shots. This number would likely be even lower if it weren’t for Rob Dillingham and Antonio Reeves’ affinity for taking more of them than the rest of the team, but to their credit, they are knocking them down.
Combined, Reeves and Dillingham are shooting 40.1 percent from the midrange, which is better than most players in college basketball.
Kentucky likes to shoot ’em deep
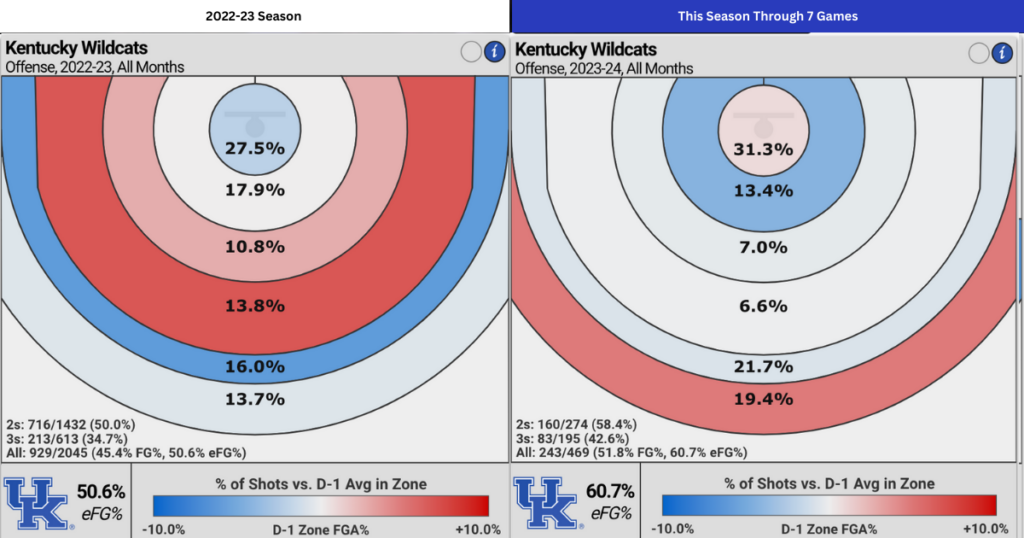
No Kentucky team under John Calipari has shot more 3s than this one. At 27.9 shots from behind the arc per game on average, Kentucky ranks 20th in the nation. In total, 41.1 percent of this team’s shots come from 3, compared to just 29.7 percent last year.
However, a further look into the shot chart shows that not only do these ‘Cats like shooting from deep, they like shooting them from really, really deep. Out of 191 total 3s taken this year, almost half of them (91, to be exact) have come from beyond 25 feet. Remember, the 3-point line is 22 feet-1 and 3/4 inches, so they are very comfortable shooting from three feet behind the line…at least.
Top 10
- 1Hot
Jaland Lowe
Pope shares latest on Lowe's shoulder
- 2Trending
KSR turns 20
Two decades, can you believe it?
- 3New
Pope found another No. 9
27 ÷ 3 = 9
- 4
Lengthy Injury Report
UK stars are banged up.
- 5
Josh Irving
Intel before the decision.
Get the Daily On3 Newsletter in your inbox every morning
By clicking "Subscribe to Newsletter", I agree to On3's Privacy Notice, Terms, and use of my personal information described therein.
When you add it all up, 19.4 percent of Kentucky’s shots come from farther than 25 feet. That’s nearly one in every five shots.
This might seem like a bad idea, but the thing is, they’re making them. Kentucky is shooting an insanely high 45.1 percent from 25 feet and beyond. Most teams couldn’t even shoot that back when the 3-point line was a shade over 19 feet from the basket.
It isn’t just snipers like Antonio Reeves (8 of 17 from greater than 25 feet) and Reed Sheppard (7 of 11) showing off their range. Tre Mitchell (7 of 17), DJ Wagner (7 of 19), and Rob Dillingham (8 of 17) are all filling it up from way downtown too.
Beware. We have officially entered the era of kids growing up watching and emulating Steph Curry.
Heat Maps
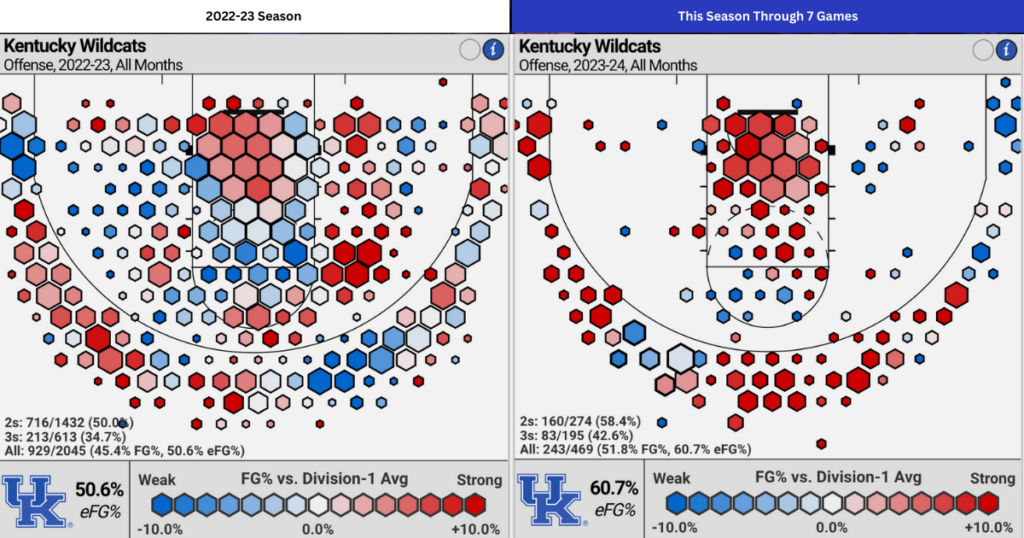
Out of all the visuals, nothing is more striking than the heat map. Comparing this year’s chart to last year’s isn’t quite fair considering the total volume of shots in just seven games is so much lower than an entire season’s worth of data, however, the trend is obvious.
More 3s, more shots in the paint, and more fun. That last one isn’t directly indicated by a red hexagon on the map, but the sheer amount of areas on the court where Kentucky has been hot this season makes the fun component implicitly clear.
Will Kentucky maintain this level of shot discipline and excellence throughout the year? I can’t wait to find out.


Discuss This Article
Comments have moved.
Join the conversation and talk about this article and all things Kentucky Sports in the new KSR Message Board.
KSBoard