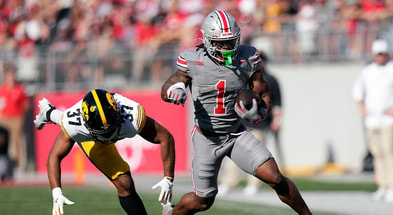
By the Numbers: Comparing Ohio State and Maryland

COLUMBUS — While Maryland scored a combined 10 points the last two weeks, it has featured one of the more respectable offenses in the Big Ten much of the season. Except, the Terrapins will have to be a lot more than just respectable to keep up with an Ohio State team that’s averaging 46.8 points per game.
Especially if head coach Ryan Day’s squad comes anywhere close to the 69.5 points the Buckeyes have averaged in the teams’ last two meetings.
Ahead of Saturday’s matchup, here’s a breakdown of how Ohio State and Maryland compare — by the numbers.
READ: Previewing Ohio State’s Week 12 matchup vs. Maryland
WATCH: Lettermen Row’s Bold Predictions for Maryland game
Scoring Offense
Buckeyes: 46.8 points per game (2nd nationally, 1st Big Ten)
Maryland: 28.3 points per game (T-63rd nationally, 7th Big Ten)
Total Offense
Buckeyes: 501.9 yards per game (6th nationally, 1st Big Ten)
Maryland: 395.8 yards per game (T-63rd nationally, 7th Big Ten)
Passing Offense
Buckeyes: 294.0 yards per game (17th nationally, 1st Big Ten)
Maryland: 241.5 yards per game (54th nationally, 4th Big Ten)
Rushing Offense
Buckeyes: 207.90 yards per game (21st nationally, 3rd Big Ten)
Maryland: 154.30 yards per game (65th nationally, 7th Big Ten)
Scoring Defense
Buckeyes: 15.6 points per game allowed (7th nationally, 5th Big Ten)
Maryland: 24.6 points per game allowed (53rd nationally, 8th Big Ten)
Total Defense
Buckeyes: 271.5 yards per game allowed (7th nationally, 4th Big Ten)
Maryland: 381.0 yards per game allowed (73rd nationally, 10th Big Ten)
Passing Defense
Buckeyes: 161.2 yards per game allowed (6th nationally, 3rd Big Ten)
Maryland: 232.1 yards per game allowed (T-76th nationally, 10th Big Ten)
Rushing Defense
Buckeyes: 110.30 yards per game allowed (18th nationally, 6th Big Ten)
Maryland: 148.90 yards per game allowed (68th nationally, 10th Big Ten)
3rd Down Conversion
Buckeyes: 47.15% (T-18th nationally, 3rd Big Ten)
Maryland: 41.78% (50th nationally, 4th Big Ten)
Opponent 3rd Down Conversion
Buckeyes: 27.89% (6th nationally, 3rd Big Ten)
Maryland: 41.45% (96th nationally, 10th Big Ten)
Red Zone TD Percentage
Buckeyes: 81.63% (2nd nationally, 1st Big Ten)
Maryland: 78.79% (4th nationally, 2nd Big Ten)
Opponent Red Zone TD Percentage
Buckeyes: 58.82% (T-59th nationally, 7th Big Ten)
Maryland: 52.38% (T-33rd nationally, 6th Big Ten)
Sacks Per Game
Buckeyes: 2.60 (T-33rd nationally, T-4th Big Ten)
Maryland: 2.10 (T-74th nationally, 9th Big Ten)
Sacks Allowed Per Game
Buckeyes: 0.70 (T-3rd nationally 1st Big Ten)
Maryland: 2.90 (T-104th nationally, 12th Big Ten)
Turnover Margin Per Game
Buckeyes: 0.80 (T-11th nationally, 1st Big Ten)
Maryland: 0.30 (T-43rd nationally, 8th Big Ten)
Time of Possession
Buckeyes: 30:30.50 (47th nationally, 6th Big Ten)
Maryland: 29:45.10 (68th nationally, 9th Big Ten)
Long Scrimmage Plays (20+ Yards)
Buckeyes: 69 (T-4th nationally, 1st Big Ten)
Maryland: 43 (T-76th nationally, 6th Big Ten)
Opponent Long Scrimmage Plays (20+ Yards)
Buckeyes: 29 (10th nationally, 4th Big Ten)
Maryland: 38 (T-31st nationally, 8th Big Ten)
Penalties Per Game
Buckeyes: 4.9 (19th nationally, 5th Big Ten)
Maryland: 7.9 (120th nationally, 13th Big Ten)
Punt Average
Buckeyes: 45.78 (8th nationally, 2nd Big Ten)
Maryland: 45.08 (18th nationally, 4th Big Ten)


