Advanced stats view Texas as a favorite in its final four games
College Football Insiders has tools available to create comparisons for possible matchups that could occur later in the season. Inside Texas uses these as part of the weekly Stat Breakdown series, and they offer specific insight into what Texas is doing on the field. The tools have Texas as favorites to win the final four games of the Longhorns’ regular season.
[Join Inside Texas TODAY with code HOOKEM and get 50% off annual memberships!]
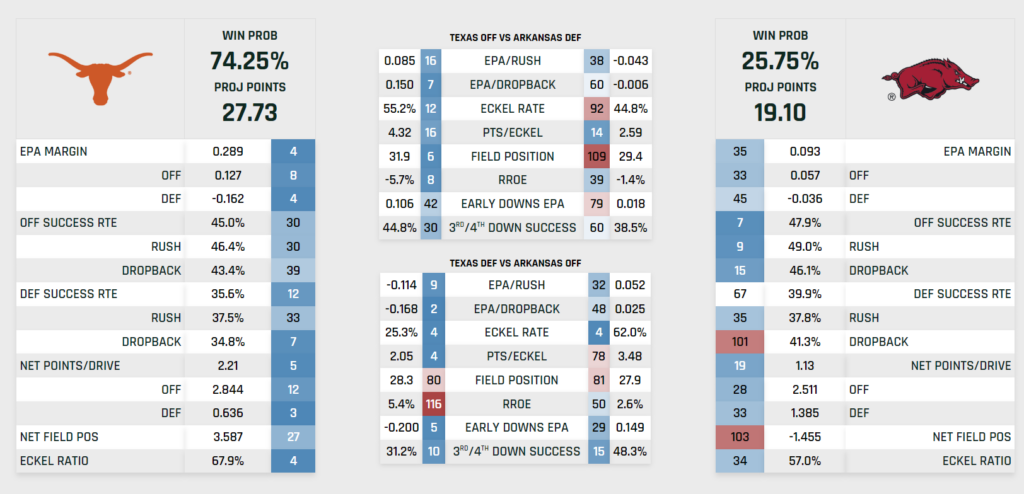
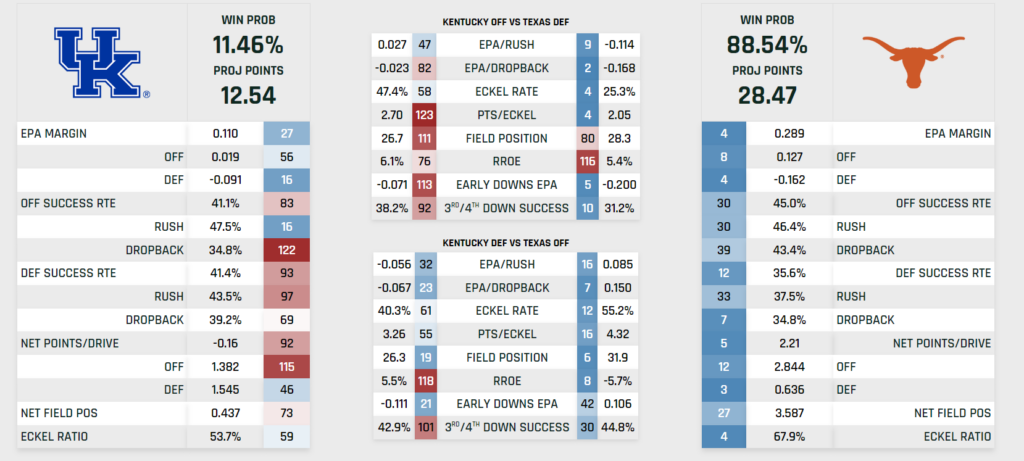
There’s one simple way of looking at data from CFI: Red = Bad, Blue = Good. That doesn’t apply for everything, like rush rate over expected.
What does that measure? Parker Fleming, it looks at given down, distance, yard line, and game state, how often do you call designed runs relative to an average team?
Fleming has reiterated that RROE is not a measure of quality. It’s a measure of what opponents are doing against a defense.
The other statistic Texas is starting to sink in is field possession. Turnovers are the culprit there.
A few other need-to-know terms, via the College Football Insiders glossary:
Expected Points Added: EPA translates yards to points in context. A 3 yard gain on 1st and 10 is bad; a 3 yard gain on 3rd and 2 is good. How can we compare? EPA takes into account the down, distance, yardline, and game state of each play to calculate the added point value of every play. It is an explosiveness-weighted measure of success: how often did you provide positive value, and on average, how much positive value did you add? It is analogous, roughly, to wOBA in baseball. A higher EPA on offense is good, and a lower EPA on defense is good.
Success Rate: A binary measure of efficiency: a success is any play where EPA >= 0, and a failure is any play with EPA < 0.
Top 10
- 1Breaking
Kyle Wittingham
Utah coach stepping down
- 2Trending
CFB Awards
Top honors for 2025
- 3
Kirby Moore
taking Wazzu job
- 4New
Biletnikoff Award
Mekai Lemon tops Jeremiah Smith
- 5
Sherrone Moore
Posts bond, released
Get the Daily On3 Newsletter in your inbox every morning
By clicking "Subscribe to Newsletter", I agree to On3's Privacy Notice, Terms, and use of my personal information described therein.
Eckel: A “quality possession” if a team scores a big play touchdown or gets a first down inside the opponent’s 40-yard line.
Some of the other terms:
- Win Pct: Actual win percentage.
- xWin Pct: Expected win percentage based on stat profile.
- Diff: The difference in actual and expected win percentage.
- PPG Margin: Actual points per game margin.
- xPTS Margin: Expected points per game margin (based on drive quality).
- EPA/G Margin: Total EPA per game margin (based on play efficiency).
- First Rte: Frequency of earning a first down on first or second down.
- ED EPA: Early downs (1st and 2nd) EPA, indicating consistent ball movement early in drives.
- ED Rush Rte: How often a team runs on first and second down, reflecting style rather than context.
- Avg 3rd: Average third down distance faced.
- 3rd Conv: Third down conversion rate.
- AYDS: Percentage of available yards gained on a drive.
- Avg FP: Average starting field position of drives.
- Eckel Rte: Frequency of creating a quality possession.
- Pts/Eckel: Points per quality possession.
Let’s cut to the chase. Texas is favored in its final four games. How does College Football Insiders see the stretch run of the Longhorns’ season playing out?
One more time: Red = Bad, Blue = Good. These projections also require a home and away team to be chosen, so those are baked into the projections.
Florida (4-3, 2-2 SEC) – November 9
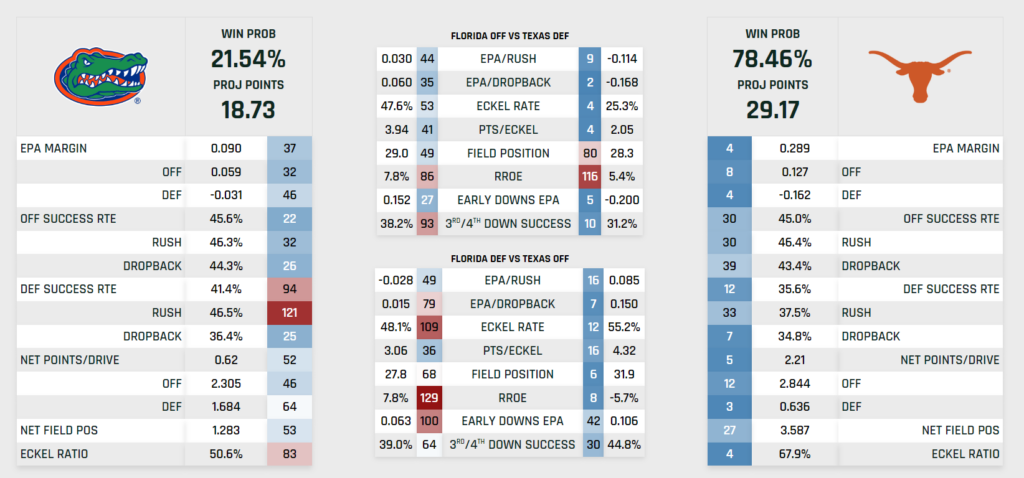
At Arkansas (5-3, 3-2 SEC) – November 16
Kentucky (3-5, 1-5 SEC) – November 23
At Texas A&M (7-1, 5-0 SEC) – November 30
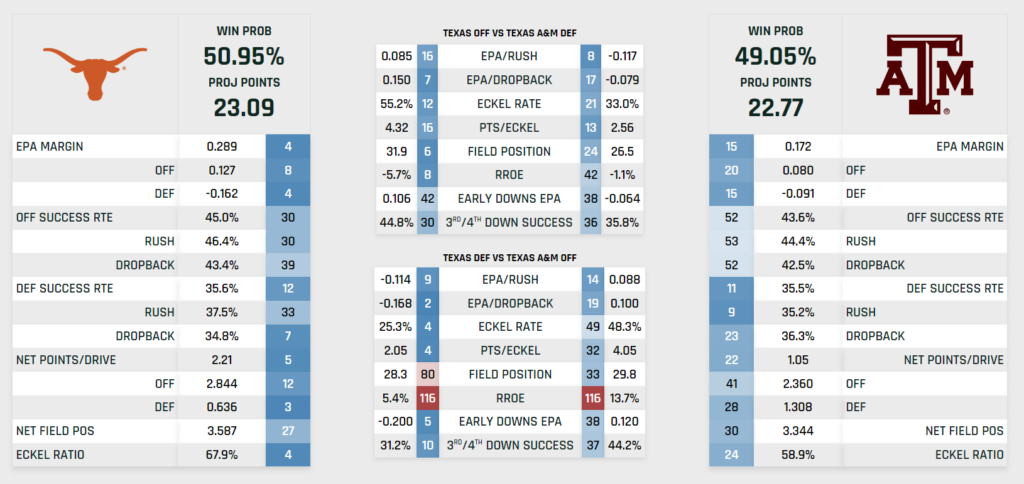
The Projected Final Scores
In case the only interesting data is projected final scores:
- Texas 29.17, Florida 18.73 – Longhorns have a 78.46% win probability
- Texas 27.73, Arkansas 19.10 – Longhorns have a 74.25% win probability
- Texas 28.47, Kentucky 12.54 – Longhorns have an 88.54% win probability
- Texas 23.09, Texas A&M 22.77 – Longhorns have a 50.95% win probability
[Subscribe to the Inside Texas YouTube channel!]
Take these numbers for the instructive data they provide, but as always the game is played on the field and not inside computers.


