Comparing statistics for Texas and Oklahoma ahead of the Red River Shootout

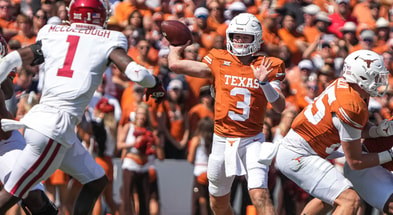
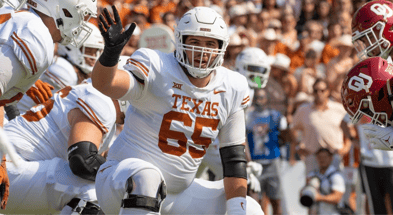
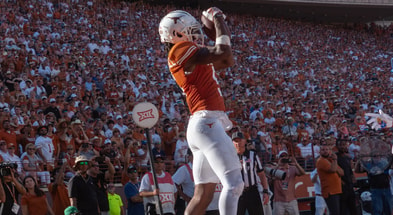
The week circled on the calendar by every fan of the Longhorns or Sooners is finally here. Texas and Oklahoma square off in the Cotton Bowl in Dallas, Texas for the annual Red River Shootout this Saturday at 11 a.m.
[Get ONE MONTH of Inside Texas Plus for $1!]
The two teams have traversed different paths to Week 6. Oklahoma started 3-0 against a middling non-conference schedule before suffering back-to-back losses versus Kansas State and at TCU. The Horned Frogs issued a beatdown to the Sooners in every phase, and even knocked OU quarterback Dillon Gabriel out of the game with an illegal hit.
Texas started 2-1, facing No. 1 Alabama and a game UTSA squad. The first time the Longhorns hit the road, they fell in overtime at the hands of the Texas Tech Red Raiders. The Longhorns got back on track last week versus West Virginia, setting up a battle of two 3-2 teams at the Fair Park.
Quarterback health is the story to watch this week, but so too are the stats put together by the Longhorns in Year 2 of Steve Sarkisian and the Sooners in Year 1 under Brent Venables.
Here are the numbers to know, including some advanced statistics from various outlets.
Texas overall SP+ ranking: No. 5
OU overall SP+ ranking: No. 6
Texas defensive SP+ ranking: No. 23
OU defensive SP+ ranking: No. 30
Texas offensive SP+ ranking: No. 7
OU overall SP+ ranking: No. 5
Texas special teams SP+ ranking: No. 35
OU special teams SP+ ranking: No. 8
Texas overall FEI ranking: No. 6
OU overall FEI ranking: No. 16
Texas offensive FEI ranking: No. 10
OU offensive FEI ranking: No. 6
Texas defensive FEI ranking: No. 22
OU defensive FEI ranking: No. 57
Texas special teams FEI ranking: No. 10
OU special teams FEI ranking: No. 24
Texas ESPN FPI ranking: No. 6
OU ESPN FPI ranking: No. 19
Texas strength of schedule ranking:, per ESPN: No. 8
OU strength of schedule ranking, per ESPN: No. 54
Texas total offense: T-61 – 417.4 yards per game
OU total offense: No. 18 – 481.4 yards per game
Texas total defense: No. 63 – 366.8 yards per game
OU total defense: No. 109 – 423.0 yards per game
Texas rushing defense: No. 44 – 120.2 yards per game
OU rushing defense: No. 119 – 198.2 yards per game
Texas rushing offense: No. 69 – 154.4 yards per game
OU rushing offense: No. 15 – 220.8 yards per game
Top 10
- 1Breaking
Pop Isaacs
Creighton guard commits to Houston
- 2
Final AP Poll
Basketball Top 25 released
- 3Hot
Way-Too-Early Top 25
Looking ahead to 2025-26 hoops
- 4
Nick Saban
Nominated for Emmy
- 5Trending
Hailey Van Lith
Stuns as SI Swimsuit cover model
Get the On3 Top 10 to your inbox every morning
By clicking "Subscribe to Newsletter", I agree to On3's Privacy Notice, Terms, and use of my personal information described therein.
Texas passing offense: No. 46 – 263.0 yards per game
OU passing offense: No. 50 – 260.6 yards per game
Texas passing yards allowed: No. 90 – 246.6 yards per game
OU passing yards allowed: No. 65 – 224.8 yards per game
Texas 3rd down conversion percentage: No. 77 – 37 percent
OU 3rd down conversion percentage: No. 72 – 38.8 percent
Texas 3rd down conversion percentage defense: No. 94 – 41.9 percent
OU 3rd down conversion percentage defense: No. 89 – 40.5 percent
Texas 4th down conversion percentage: T-7 – 83.3 percent
OU 4th down conversion percentage: T-66 – 50 percent
Texas 4th down conversion percentage defense: No. 70 – 52.6 percent
OU 4th down conversion percentage defense: T-21 – 33.3 percent
Texas turnover margin: T-80 – -1
OU turnover margin: No. 28 – +4
Texas scoring offense: No. 32 – 36.8 ppg
OU scoring offense: T-30 – 37.0
Texas scoring defense: T-42 – 21.4 ppg
OU scoring defense: No. 67 – 25.2
Texas time of possession: No. 123 – 26:11
OU time of possession: No. 126 – 25:22
Texas net punting: No. 66 – 39.31
OU net punting: T-19 – 41.88
Texas punt return average: T-66 – 7.75 yards per return
OU punt return average: No. 12 – 15.88
Texas red zone offense: T-55 – 85.7 percent
OU red zone offense: T-16 – 94.4 percent
Texas red zone defense: T-97 – 88.2 percent
OU red zone defense: T-61 – 82.4 percent
Texas QB Quinn Ewers’ top performance: ULM – 16-of-24, 225 yards, 2 TD, 1 INT
Texas QB Hudson Card’s top performance: WVU – 21-of-27, 303 yards, 3 TD
OU QB Dillon Gabriel’s top performance: Kansas State – 26-for-39, 330 yards, 4 TD
Texas RB Bijan Robinson’s top performance: UTSA – 20 carries, 183 yards, 3 TD
OU RB Eric Gray’s top performance: Nebraska – 11 caries, 113 yards, 2 TD
Texas WR Xavier Worthy’s top performance: WVU – 7 catches, 119 yards, 2 TD, 1 passing TD
OU WR Marvin Mims‘ top performance: Kent State – 7 catches, 163 yards, 2 TD
Texas K Bert Auburn: 22-of-22 PAT, 10-of-12 FG, Long 49
OU K Zach Schmit: 24-of-24 PAT, 5-of-6 FG, Long 44


