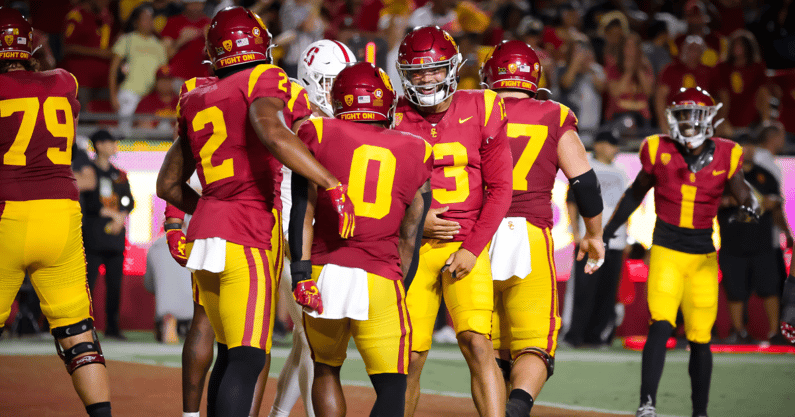
USC is six games into its 2023 regular season and the No. 10 Trojans are sporting a perfect 6-0 record, including 4-0 in conference play. At the end of the year, the win-loss record is the only number that will matter. But halfway through the season, we’re taking a look at where the Trojans rank, both as a team and individually, in some key statistical categories.
USC Offense
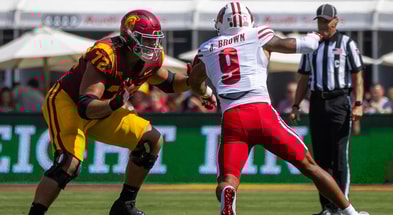
USC Stat Pac-12 Rank FBS rank Pac-12 leader Points/Game 51.8 1st 1st USC Total Yds/Game 523.3 3rd 4th Washington Yds/Play 8.49 2nd 2nd Washington Rush Yds/Game 168.2 5th 55th Oregon Yds/Rush 5.97 2nd 6th Oregon Pass Yds/Game 355.2 3rd 3rd Washington 3rd Down Pct. 42.9 5th T – 45th WSU Turnovers 4 3rd T – 10th Oregon Turnovers/Game .67 3rd T – 10th Oregon Interceptions 1 T – 1st T – 4th T – Ore, USC Fumbles Lost 3 T – 6th T – 56th Oregon Times Sacked 11 T – 5th T – 60th T – Ore, Wash Times Sacked/Game 1.83 T – 5th T – 60th T – Ore, Wash Red-Zone TD Pct. 82.8 2nd 4th OSU Red-Zone Scoring PCT 89.7 T – 5th T – 37th OSU Time of Poss. 26:57 12th 119th Utah Ave. Starting Field Pos. 31.7 2nd 38th Cal PPG Diff. +24.8 3rd 8th Oregon Turnover Margin +4 T – 4th T – 20th Colorado Plays of 10+ Yards 119 1st 1st USC First Downs/Game 25.2 3rd 12th Oregon
USC Individual Offensive Players
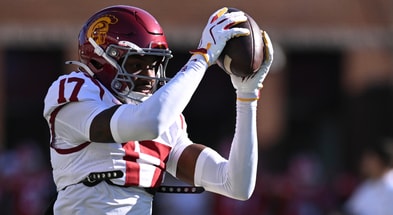
Player Stat Pac-12 Rank FBS Rank Rush Yds/Game MarShawn Lloyd 86.5 3rd 30th Yds/Rush MarShawn Lloyd 7.75 3rd 9th Rushing TDs Caleb Williams 6 3rd T – 24th Pass Yds/Game Caleb Williams 301.3 4th 12th QB Rating Caleb Williams 205.7 1st 1st TD Passes Caleb Williams 22 1st 1st Passing Yds/Att Caleb Williams 10.9 2nd T – 2nd Comp. Pct. Caleb Williams 71.7 5th 16th Receiving Yds/Game Tahj Washington 76.0 8th 49th Rec. TDs Brenden Rice 7 T – 2nd T – 6th Yds/Rec. Tahj Washington 21.7 1st 13th Yds from Scrimmage/Game MarShawn Lloyd 99.7 7th 46th Plays of 10+ Yards MarShawn Lloyd 20 T – 3rd T – 31st
USC Defense
USC Stat Pac-12 Rank FBS rank Pac-12 leader OPP Points/Game 27.0 8th T – 79th T – Ore, Utah Opp Total Yds/Game 421.3 10th 112th UCLA Opp Yds/Play 5.72 9th 84th UCLA Opp Rush Yds/Game 157.0 11th 92nd UCLA Opp Yds/Rush 4.19 10th 80th UCLA Opp Pass Yds/Game 264.3 9th T – 115th Oregon Opp 3rd Down Pct. 38.9 8th 73rd Utah Opp Turnovers 8 T – 5th T – 58th Cal Opp Turnovers/Game 1.33 8th T – 72nd UCLA Interceptions 4 T – 7th T – 75th T – Colo, UCLA, Wash Fumbles Recovered 4 T – 5th T – 28th Cal Sacks 22 1st T – 4th USC Sacks/Game 3.67 1st T – 6th USC Tackles for Loss 57 1st T – 1st USC TFL/Game 9.5 1st T – 2nd USC Opp Red-Zone TD Pct. 64.7 7th T – 87th UCLA Opp Red-Zone Scoring PCT 94.1 11th 123rd UCLA Opp Plays of 10+ yards 86 11th 105th Oregon Opp First Downs/Game 22.7 10th 121st Utah Total Penalties (Off + Def + ST) 48 11th 126th Utah Pen. Yds/Game 71.2 10th 122nd Utah
USC Individual Defensive Players
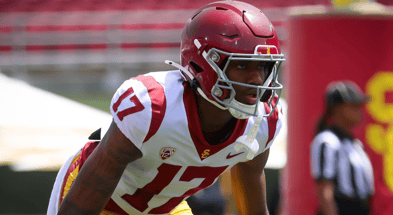
Player Stat Pac-12 Rank FBS Rank Solo Tackles Jaylin Smith 30 2nd 19th Sacks Jamil Muhammad 6 T – 2nd T – 6th Sacks Solomon Byrd 5 T – 4th T – 11th Tackles for Loss Jamil Muhammad 10 2nd T – 8th Passes Defended Calen Bullock 6 T – 1st T – 33rd Fumbles Forced Solomon Byrd 3 T – 1st T – 3rd
USC Special Teams
USC Stat Pac-12 Rank FBS Rank Pac-12 Leader Punting Avg. 44.55 4th 28th Oregon Field Goal Pct. 60.0 11th 110th Oregon Touchback Pct. 40.0 10th 91st WSU Kickoff Return Avg. 24.09 2nd 25th ASU Punt Return Avg. 16.64 2nd 15th OSU Opp KO Return Avg. 0 2nd T – 6th Washington Opp Punt Return Avg. 19.86 7th 70th ASU